
| |||
|---|---|---|---|
| |||
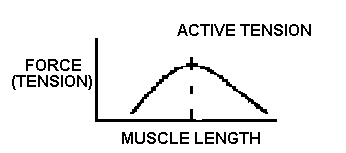
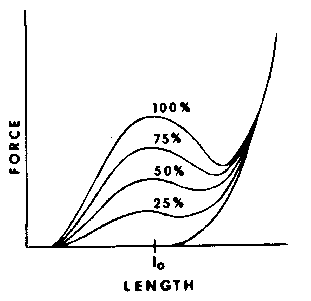
Therefore, the active length-tension curve is dome-shaped. The curve's amplitude (the height of the dome) varies with the amount of active force that the muscle's motor units generate. This graph (Winter, 1990, Fig. 7.9, p. 174) shows the curve at various percentages of motor unit activation.

|
|---|
The active length-tension curve is theoretical; we can't measure it directly. We obtain the curve by subtracting a passive length-tension curve from a length-tension curve that displays the muscle's isometric force development at different lengths.
More detailed information on the anatomical basis of muscle's length-tension properties is available in the print references and at a web site that University of Bristol (UK) provides regarding length-tension and load-velocity relationships.
Smith, L.K., Weiss, E.L. & Lehmkuhl, L.D. (1996). Brunnstrom's clinical kinesiology (5th ed.). Philadelphia: F.A. Davis.
Winter, D. (1990). Biomechanics and Motor Control of Human Movement. New York: John Wiley.